Showing posts with label graphs. Show all posts
Showing posts with label graphs. Show all posts
Sunday, December 11, 2016
Population pyramids
Here you have some videos about population pyramids and what they teach us about the demographic situation of a country:
Wednesday, April 6, 2011
Veto power in the United Nations
To veto means to reject a decision made by someone and to have the right of stopping the application of this decision. There are five countries in the United Nations that have the right of vetoing the decisions made by other countries. These five nations are China , the USA , Russia , the United Kingdom
This graph shows the current composition of the Security Council:


On this link you can read more about the use every country has made of the veto power:
And the following cartoons criticize the use of the veto power:


Tuesday, November 23, 2010
Unemployment rate: updated figures
As you may know, unemployment is one of the most important problems workers have to face. Here you have some charts and graphs that show the official unemployment rates in different countries:
- The first chart refers to the European Union´s unemployment rates in 2004 and 2009. This information is very useful to compare how the economic situation has changed and how unemployment rates have raised in the last five years. You can also compare the differences between the unemployment rates per sex and age groups (younger and older workers):

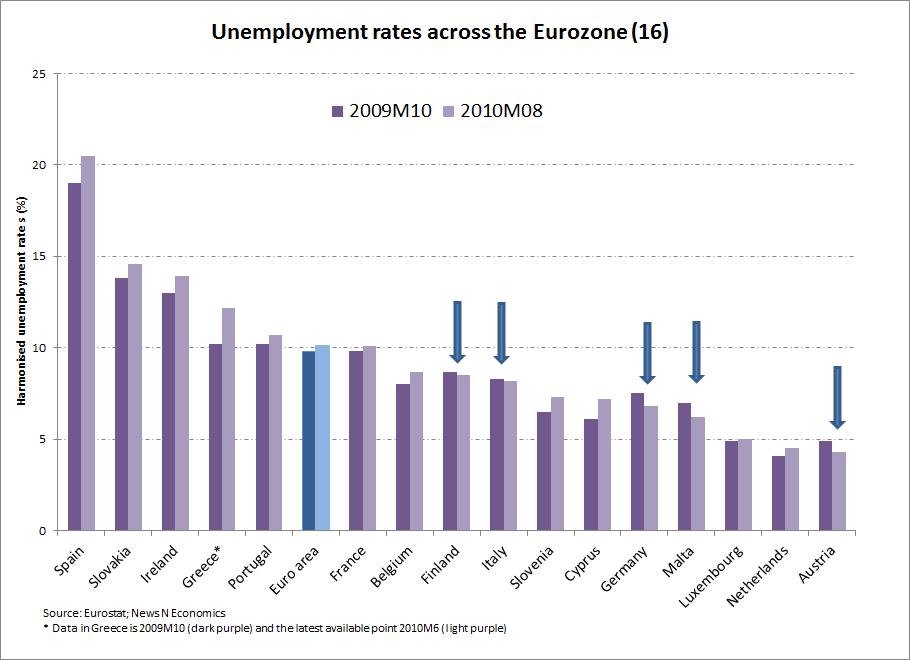
- The following graph shows the unemployment rates in the countries that belong to the Eurozone (the European countries that use the Euro as currency). The data correspond to September 2010. You can compare the evolution of the unemployment rate in the last year in the different countries of the Eurozone:

- This is another interesting graph that reflects the evolution of unemployment rate in the United States in the last two years:

- This is another interesting graph that reflects the evolution of unemployment rate in the United States in the last two years:

- On this link you can find updated data of the evolution of unemployment rates in the different states of the USA:
http://www.bls.gov/news.release/laus.nr0.htm
- And the last link refers to Spain. It explains the process unemployed workers have to follow to perceive the unemployment benefit and the amount of money they will receive in relation with the time they have been working. The link is in Spanish:
http://www.oficinadetreball.cat/socweb/export/sites/default/socweb_es/ciutadans/pres_desocup/prestacio_atur.html
Monday, November 22, 2010
Low qualified workers and equity policies
As some people didn´t do their work, I´m going to include some links about some concepts we studied in last week´s lessons.
As we have studied, qualification is the most important condition for workers. Low qualification becomes one of the most important problems in times of economic crisis, because low qualified workers are the first to lose their jobs. Here you have some graphs about low qualified workers in the European Union. You can observe that Spain is among the countries that have more low qualified workers in the labour market. This may also be a reason to explain the high unemployment rate our country has:
Low-qualified men and women aged 25–49 years, 2007 (%)

Low-qualified men and women aged 50–64 years, 2007 (%)

You can find a detailed report about low qualified workers in the European Union in the following link:
Other important concepts we studied last week referred to equity policies and possitive discrimination. The following link will bring you to the European Charter of Fundamental Rights. There you will find a definition of possitive discrimination/ affirmative action and what the law says about equality in Europe:
http://www.eucharter.org/home.php?page_id=98
The following link offers a list of pros and cons related to positive discrimination/affirmative action. Some of them also appeared in the classroom when we discussed this subject:
http://www.idebate.org/debatabase/topic_details.php?topicID=40
And this is an interesting survey published in The New York Times last June. The survey shows that the theoretical equality between men and women doesn´t exist. Many people still consider that men have more rights than women to work outside or to get better jobs. There is still a long way to real equality.

Subscribe to:
Posts (Atom)